
TL;DR
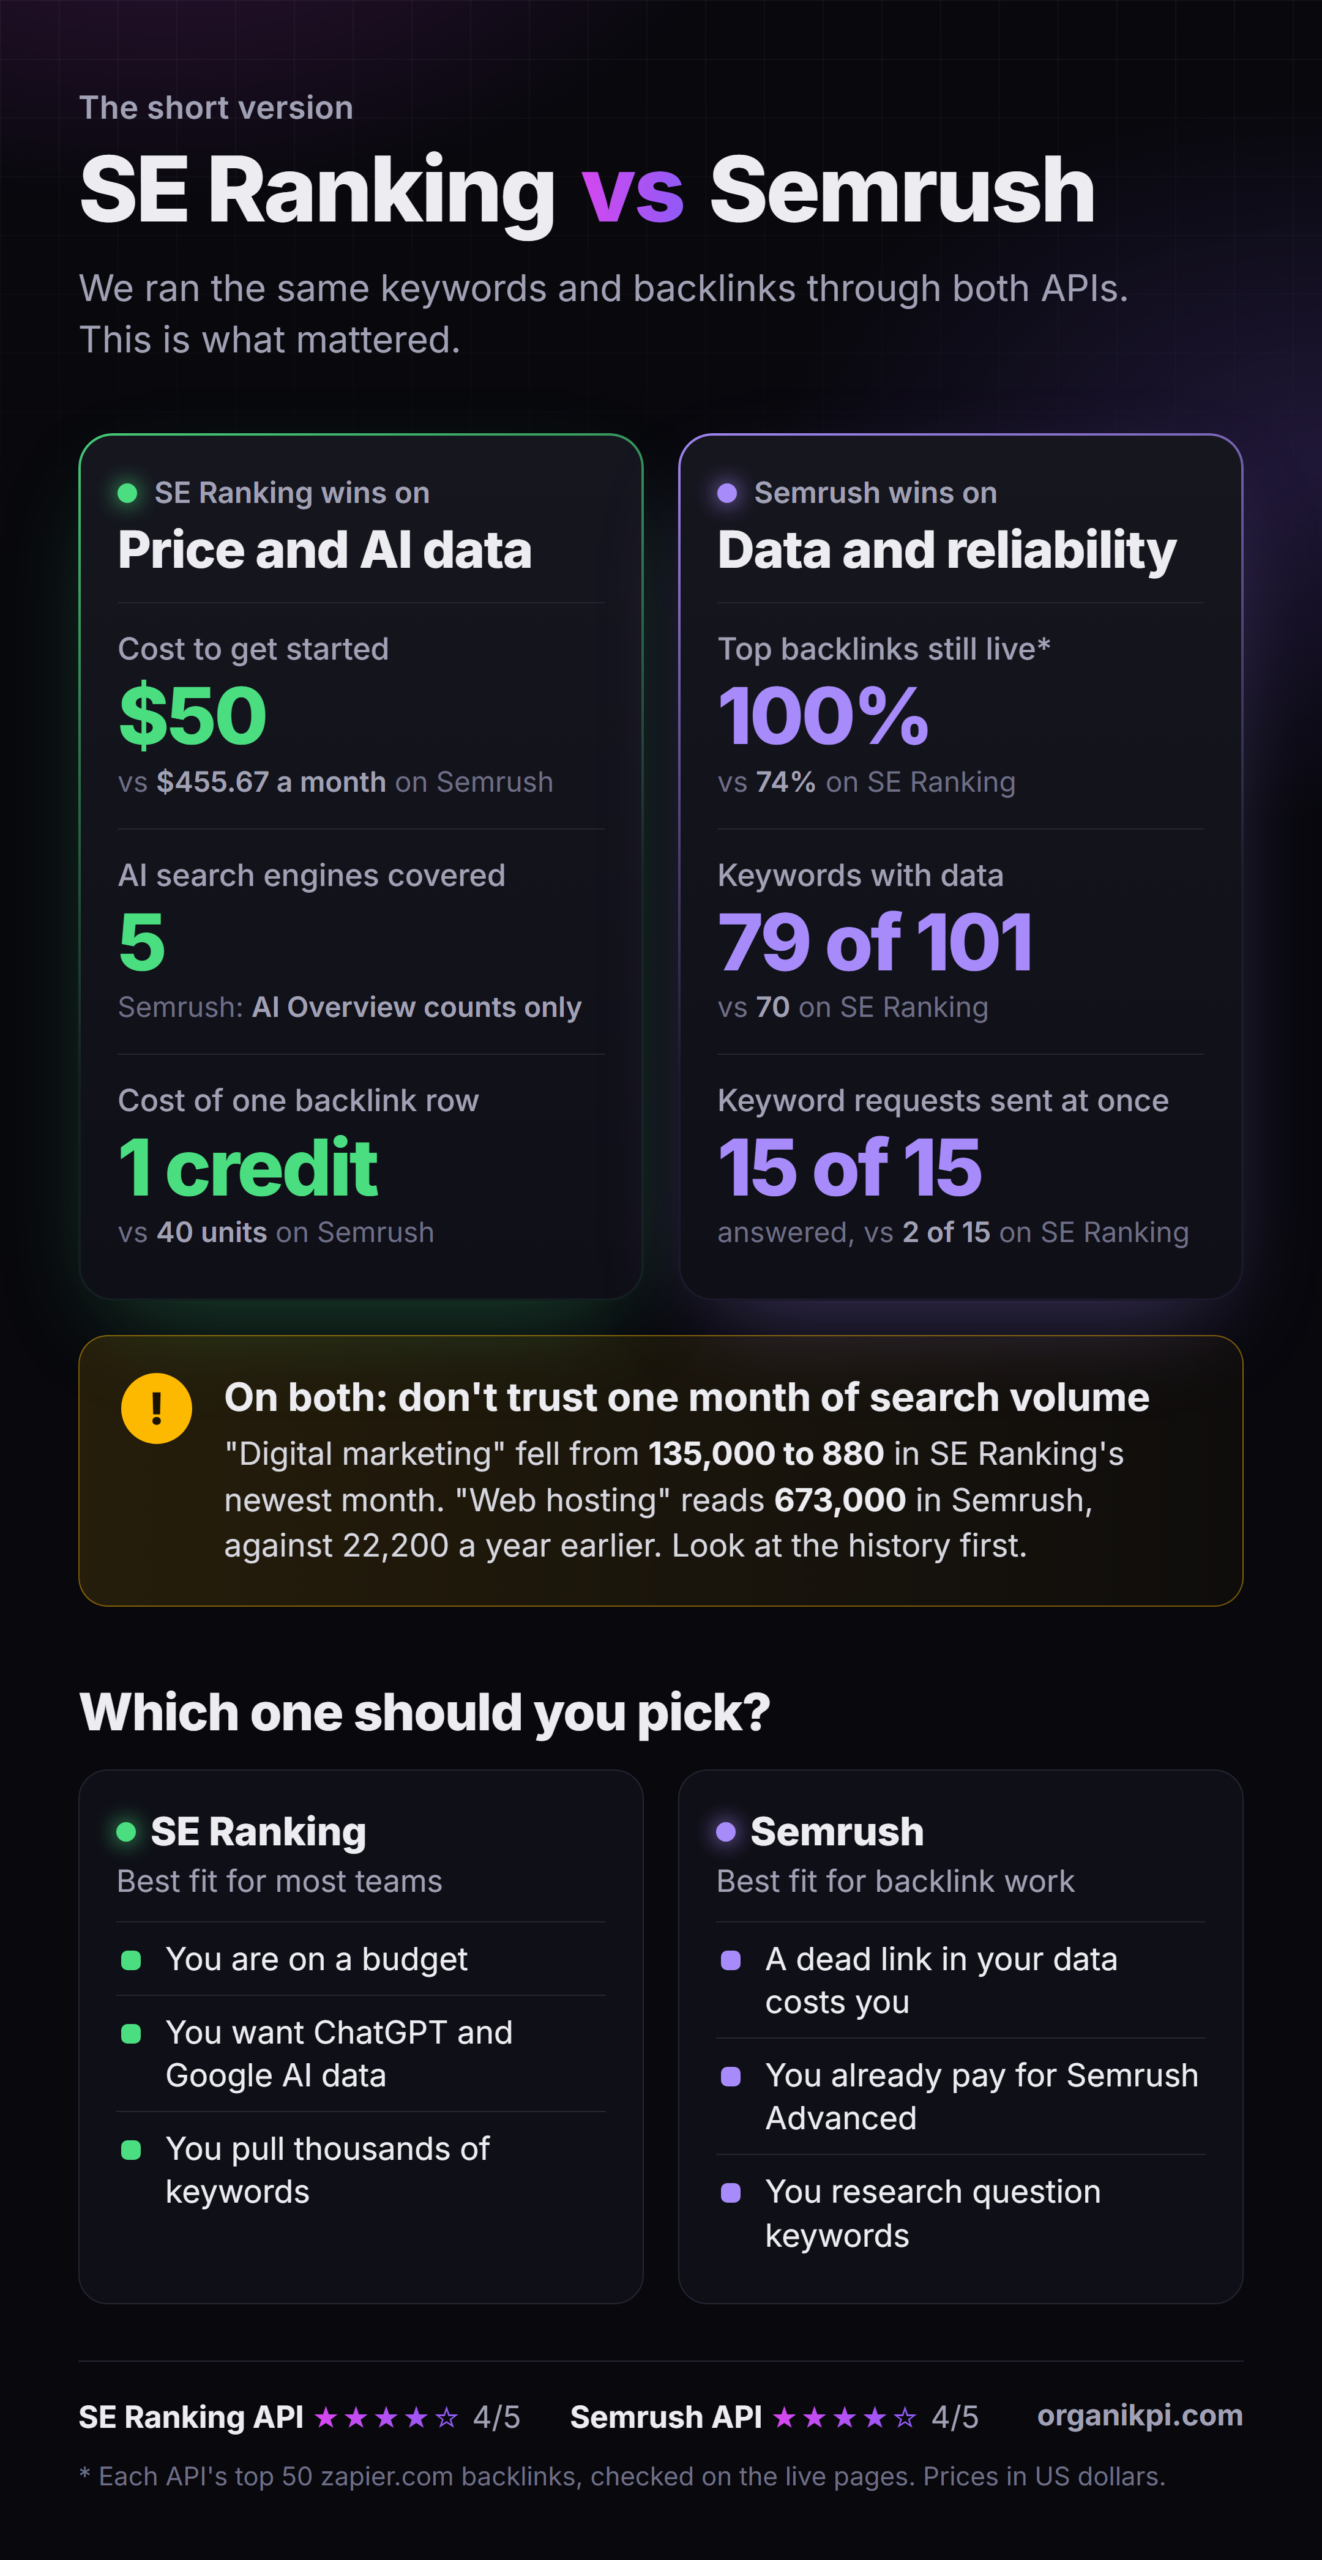
- SE Ranking's API suits most teams, while Semrush's has fresher backlinks.
- Both showed sudden jumps in recent keyword data, so check the history.
- 101 keywords cost 100 SE Ranking credits, or 790 Semrush units.
- Semrush's SEO API needs its Advanced plan, from $455.67 a month.
- Verdict: both get 4 of 5; price decides for most teams.
SE Ranking’s API is the better buy for most teams that want SEO data inside their own tools. Metrics for 101 keywords cost 100 SE Ranking credits against 790 Semrush units, and SE Ranking reports on five AI search engines where Semrush’s SEO API has two AI Overview counts. Semrush’s API returned fresher backlinks, found data for more keywords, and answered a burst of keyword requests that SE Ranking refused. It is also harder to reach: Semrush lists its SEO API only on the Advanced plan, $455.67 a month billed annually, with units bought on top.
The common view is that Semrush has more data and SE Ranking costs less. Through the APIs, that is only partly true. Semrush’s backlinks were fresher and its keyword coverage wider, but SE Ranking counted more ranking keywords on six of seven large domains, and it is the only one of the two with per-engine AI search data.
What we sent through both APIs
Both APIs got the same inputs, all on the US database:
- 101 keywords from mixed industries: 25 head terms, 25 mid-volume terms, 26 long-tail phrases and 25 questions.
- The top 50 backlinks for zapier.com, a large site, and organikpi.com, a small one.
- hubspot.com for AI search data.
- Seven large domains plus organikpi.com for domain totals, with our own Search Console as the reference.
On the Semrush side we used the v3 SEO API. Semrush’s release notes mark its v3 keyword and backlink methods as deprecated, though they still work. The v4 versions return JSON and take the key in a header, but they are in Early Access and need a separate v4 key.
How each API answers the same request
The two APIs return the same kind of data in very different shapes. SE Ranking answers in JSON. You send the key in an Authorization header and post up to 5,000 keywords in one request. Each keyword comes back with volume, CPC, difficulty, intent, competition and up to 12 months of absolute search volume.
Semrush’s v3 API answers in semicolon-separated text. The key goes in the query string, and the batch keyword report takes up to 100 keywords per request. You pick the columns with export_columns. Its trend column holds 12 relative values between 0 and 1, so it shows the shape of the year without monthly volumes.

The numbers differ as much as the formats. For “email marketing”, SE Ranking reported 74,000 searches a month and Semrush 1,220,000, a gap of more than 16x. Their CPC figures were close, at $36.40 and $30.30, and their difficulty scores were one point apart.
Keyword data: same order, different sizes
Coverage
Semrush returned data for 79 of the 101 keywords and SE Ranking for 70. Both covered all 25 head terms and 12 of the 26 long-tail phrases. The gap opened on questions: Semrush had data for 17 of the 25, SE Ranking for 9. If your content plan starts from question keywords, that gap will show up in every export.
Search volume
On the 69 keywords both APIs covered, the two agreed on which keywords are bigger and disagreed on how big they are. The rank correlation was 0.84, which means a list sorted by either API’s volume comes out in a similar order. At the median, though, SE Ranking’s volume was 0.37 of Semrush’s, and only 35% of keywords landed within 2x of each other.

Part of that gap comes from keywords whose recent data jumped in one API or both. On the 14 keywords whose latest value stayed close to its own prior median in both APIs, agreement improved: SE Ranking’s volume was a median 0.62 of Semrush’s, 57% landed within 2x, and the rank correlation rose to 0.92.
Recent months are the weak spot
SE Ranking’s volume field is the last month of its own history, which ran 11 or 12 months for every keyword it returned. When that last month goes wrong, the headline number goes with it. For 18 of 69 keywords, the newest month sat more than 2x away from the median of the months before it: 8 up and 10 down. “Digital marketing” read between 74,000 and 135,000 for eleven months and then 880. “Running shoes” dropped from a median of 284,500 to 1,900.
Semrush’s trend column jumps too, mostly upward. Its last value was the year’s peak, 1.00, for 29 of 79 keywords. For 26 of 72 keywords it sat more than 2x away from the median of the values before it: 23 up and 3 down. “Web hosting” sat between 0.07 and 0.13 for eleven months, then jumped to 1.00. Its volume field read 673,000. Semrush’s own snapshot of the keyword from a year earlier, which costs 50 units per row, put it at 22,200, close to SE Ranking’s median of 27,100.

So read neither headline volume on its own. With SE Ranking, take the median of the months it already returns. With Semrush, check the trend column first, and pull a past snapshot for any keyword that matters before you trust a sudden jump.
Difficulty and CPC
Keyword difficulty agreed less than volume rank did. The median gap was 13 points on the 0 to 100 scale, 44% of keywords landed within 10 points, and the rank correlation was 0.70. SE Ranking scored 5.6 points lower on average. CPC ranked keywords most alike, with a rank correlation of 0.97, though SE Ranking’s figures were a median 0.61 of Semrush’s.
Domain data, checked against Search Console
Search Console listed 935 US queries for organikpi.com over a month. Semrush’s API returned 268 US keywords for the domain, and SE Ranking’s returned 36. Both APIs only count keywords in their own databases, so neither should match Search Console, but Semrush returned more than seven times as many as SE Ranking.
On seven large domains, including hubspot.com, shopify.com and canva.com, the two disagreed in opposite directions. SE Ranking reported more ranking keywords for six of the seven. Semrush reported more organic traffic for six of the seven. For hubspot.com, SE Ranking counted 1,863,858 keywords and 836,223 monthly visits; Semrush counted 833,163 keywords and 2,659,808 visits. Without access to those sites’ analytics, neither figure can be called right.
Backlinks: are the links still there?
A backlink list is only useful if the links exist. A stale row inflates a competitor’s profile, sends outreach to pages that dropped the link, and makes it harder to audit the links you built or paid for. We took each API’s top 50 backlinks for zapier.com and organikpi.com, sorted by its own page authority score, and checked whether each linking page still carries the link.

For zapier.com, Semrush did better. All 45 rows it presented as live were still there, 37 as hyperlinks and 8 as form or frame references. SE Ranking’s list held 28 live links out of the 38 we could check, or 74%. Six of the other ten pages no longer carried the link, and four of the pages were gone entirely. The age of the data explains most of it: 23 of SE Ranking’s 50 rows were last crawled in 2019 or 2020. The median Semrush row had been seen 18 days earlier, against 184 days for SE Ranking.

Twelve of SE Ranking’s zapier.com rows could not be checked. Ten were Product Hunt redirect URLs that refused our requests, one page refused the same way, and one short link returned a server error.
For organikpi.com, a much smaller site, both lists were fresh. SE Ranking’s links were 94% live and Semrush’s 98%. SE Ranking’s list leaned heavily on one site, which supplied 30 of its 50 rows. Semrush’s covered 35 different sites against SE Ranking’s 16.
Semrush’s lists need two caveats. First, it marks links it believes are lost, and those rows are excluded above. Of the seven it flagged, four were gone and three were still live. Second, the 8 form and frame rows on zapier.com point at Zapier’s webhook and embed hosts. Semrush returns form and frame columns, so you can filter them out.
The two top-50 lists also barely overlapped. Each target had exactly one source URL in common between the APIs, so the two indexes are ranking very different pages as a site’s strongest links.
Both APIs return first-seen and last-seen dates on every row, so one filter protects you from stale data. Drop rows not seen in the last 90 days before you use a list for outreach or reporting. On SE Ranking’s zapier.com list, that filter would have removed all ten dead links, along with 14 live ones.
AI search data
This is the clearest difference between the two APIs. SE Ranking sells AI visibility data per domain and per engine through one endpoint, at 800 credits per call. It covers ChatGPT, Perplexity, Gemini, Google AI Overviews and Google AI Mode. We ran it for hubspot.com on all five.

Each call returns the brand SE Ranking detected for the domain, here “HubSpot”, plus two headline figures: brand presence and link presence. SE Ranking’s docs do not say exactly how either is counted, so they are most useful compared across engines:
| Engine | Brand presence | Link presence | AI opportunity traffic |
|---|---|---|---|
| Google AI Overviews | 60,219 | 72,115 | 60,945 |
| ChatGPT | 16,657 | 18,216 | 0 |
| Google AI Mode | 11,375 | 16,489 | 0 |
| Gemini | 5,467 | 1,612 | 0 |
| Perplexity | 877 | 5,155 | 0 |
On Gemini, brand presence was more than three times link presence, which looks like the AI search version of an unlinked brand mention. Perplexity went the other way. AI Overviews and AI Mode often cite different sources for the same query, and the API keeps them apart, which matters if you report on both.
Each response also carries a monthly series. ChatGPT’s link presence for HubSpot rose from 3,756 to 18,216 across the seven months in the series, while Perplexity’s fell from 8,114 to 5,155 and AI Mode’s from 22,551 to 16,489. Because ChatGPT’s sources change from one run to the next, the direction of each series tells you more than any single month.
Two parts of the response were thin. AI opportunity traffic, SE Ranking’s traffic estimate, was zero for every engine except AI Overviews. The average position, overall traffic and organic traffic series came back empty on all five. SE Ranking also sells a leaderboard that ranks a domain against up to 10 competitors by AI share of voice, at 7,500 credits per call. We did not run it.
At 800 credits per call, the data is cheap to collect at scale. Tracking 50 competitor domains on all five engines once a month is 250 calls, or 200,000 credits, which is $40 at SE Ranking’s Wallet rate. SE Ranking refreshes this data monthly, so pulling it more often adds cost without adding data.
Semrush’s SEO API has no per-engine AI data. Its domain report offers two AI Overview counts. For hubspot.com, 750,300 of its ranking keywords trigger an AI Overview, and hubspot.com appears inside 33,839 of them. Semrush’s AI Visibility Toolkit covers ChatGPT, Perplexity and Gemini, but it lives in the web app. Semrush’s API documentation points AI search traffic data to its Trends API, which is sold separately and was not part of this test.
What it costs
The two vendors bill differently, so cost comes down to how many rows you pull and which calls you make. SE Ranking charges its keyword export per request and its backlink lists per row. Semrush charges per row returned: of our 101 keywords, it billed the 79 it had data for.

| Job | SE Ranking | Semrush |
|---|---|---|
| Volume, CPC, difficulty and trend for 101 keywords | 100 credits, one request | 790 units, 79 rows billed |
| The same for 5,000 keywords | 100 credits, one request | Up to 50,000 units, 50 requests |
| 50 backlink rows | 50 credits | 2,000 units (v3) |
| AI search overview, one engine | 800 credits | No per-engine data; AI Overview counts cost 10 units |
| One keyword’s volume for a past month | Up to 12 months included | 50 units per row |
SE Ranking publishes its prices. Wallet credits cost $50 for 250,000 and never expire. An annual standalone plan starts at $2,148 for 12 million credits, with no web app needed. Every SE Ranking platform plan also includes a monthly allowance of API credits. At the Wallet rate, our 101-keyword pull cost about 2 cents, 1,000 backlink rows cost 20 cents, and one AI search call cost 16 cents. A 14-day free trial includes 100,000 API credits.
One budgeting note: SE Ranking’s own cost table lists the keyword export at 10 credits per keyword. Its endpoint page says 100 credits per request, and that matches what our account was charged.
Semrush lists its SEO API only on the Advanced plan, at $455.67 a month billed annually or $549 month to month. Units are bought separately, in packages inside the app, and Semrush does not list a per-unit price on its pricing page or in its API docs. That puts the entry cost at $455.67 a month before the first unit, against $179 a month for SE Ranking’s 12-million-credit annual plan or a one-off $50 for 250,000 Wallet credits.
Errors, speed and rate limits
We sent both APIs the same four bad requests: a wrong key, an unknown database, an empty keyword and a 500-character keyword. SE Ranking answered the first three with matching HTTP errors (401, 404 and 400) and a JSON message. It accepted the long keyword and reported that it had no data for it.

Semrush answers errors as text lines that start with ERROR and a code. Two of the four came back with HTTP 200, the status code for success: the unknown database and the empty keyword. Code that only checks the status will treat those as valid empty results. With Semrush’s v3 API, check the body for ERROR before you parse it.
Semrush was also faster from our machine in Israel. Over 10 calls, its keyword call had a median response of 782 ms against SE Ranking’s 1,603 ms. Over 5 calls, its domain overview took 484 ms against 1,091 ms.
We then sent 15 keyword requests at once to each API. Semrush answered all 15. SE Ranking answered 2 and refused 13 with HTTP 429, its rate-limit error. The same burst against SE Ranking’s backlink endpoint went through 15 of 15, so the throttling looks specific to the keyword export. SE Ranking documents 10 requests per second for its data API. Semrush documents 10 requests per second and 10 simultaneous requests, and it still answered all 15. Neither sent rate-limit headers, so your code has to pace itself and retry on 429.

Per-call speed matters less on big batches. SE Ranking takes up to 5,000 keywords in one request, and our 101-keyword request came back in about 2 seconds. Semrush’s batch report stops at 100 keywords, so 5,000 keywords means 50 requests.
Spend tracking differs too. Semrush has a free endpoint that returns your unit balance, and it updated as soon as each call finished. SE Ranking’s balance endpoint is also free, but it lagged several minutes behind our calls, so you cannot read the cost of a single call right after making it.
Keys, limits and terms of use
SE Ranking uses one key for everything: its data API and its project API, which manages your own tracked sites, keywords and audits. The data API allows 10 requests per second and the project API 5. During the free trial the data API is held to 1 request per second. One backlink request returns up to 10,000 rows, and a separate raw endpoint returns up to 100,000 with a cursor. Only successful responses are billed. SE Ranking offers a Postman collection and no official SDKs.
Semrush splits its keys by version: a v3 key works only with v3 endpoints and a v4 key only with v4. In return, v4 lets you create up to 100 keys, each with its own permissions and expiry, which helps when several tools or contractors share one account. A v3 report returns up to 100,000 rows per request, with offsets beyond that.
Read the terms if you plan to store or resell the data. Semrush does not allow you to cache data from its API for more than one month without its written consent, which matters if you planned to build your own history from monthly pulls. SE Ranking’s terms allow commercial use of its API data, with consent required for direct competitors of SE Ranking. Check its terms of service for storage rules before you build on it.
Which API should you buy?
| SE Ranking API | Semrush API | |
|---|---|---|
| Access | Any SE Ranking plan, or credits from $50 | Advanced plan ($455.67/mo billed annually) plus units |
| Volume, CPC and difficulty for 101 keywords | 100 credits | 790 units |
| One backlink row | 1 credit | 40 units (v3) |
| Keywords with data, of 101 | 70 | 79 |
| Question keywords with data, of 25 | 9 | 17 |
| Top 50 zapier.com backlinks still live | 28 of 38 checkable (74%) | 45 of 45 shown as live (100%) |
| AI search engines covered | 5 | AI Overview counts only |
| 15 simultaneous keyword requests | 2 answered | 15 answered |
| Median response, keyword call | 1.6 s | 0.8 s |
| Format | JSON, key in a header | Semicolon text, key in the URL (v3) |
Both APIs score four out of five, and for most teams price decides between them. That points to SE Ranking. If the job is keyword metrics at volume, AI search reporting, a weekly pull into a Looker Studio dashboard, or SEO automation that runs every night, it does the work at a much lower entry price and with cleaner responses. Read its newest-month volumes with the history next to them, pace your keyword requests, and filter old backlink rows on large sites.
Pick Semrush if backlinks are the core of the job and a dead link in your data costs you money, or if you need coverage of question keywords. You will pay for that: the Advanced plan comes first, and every v3 backlink row costs 40 units. If you already pay for Advanced to use the web app, the API is a reasonable add-on.
If what you need is prompt-level tracking of your own brand in AI answers rather than domain totals, neither data API is the right tool. A dedicated AI visibility tracker lets you choose the prompts.
SE Ranking API
SE Ranking API pros
- Metrics for 101 keywords, with up to 12 months of history, cost 100 credits, about 2 cents at the Wallet rate
- Backlink rows cost 1 credit each
- AI search data for ChatGPT, Perplexity, Gemini, AI Overviews and AI Mode through one endpoint
- Takes up to 5,000 keywords in one request
- JSON responses with clear HTTP errors for bad keys, sources and empty keywords
- Credits from 50 dollars that never expire, with no web app plan required
SE Ranking API cons
- 23 of zapier.com's top 50 backlinks were last crawled in 2019 or 2020, and 28 of the 38 checkable ones were still live
- Its keyword endpoint refused 13 of 15 simultaneous requests with HTTP 429
- The newest month of volume sometimes collapses, as with digital marketing at 880 after eleven months between 74,000 and 135,000
- Returned data for 9 of 25 question keywords, against Semrush's 17
- Returned 36 US keywords for organikpi.com, where Semrush returned 268
- About twice as slow per call as Semrush
Semrush API
Semrush API pros
- Every top-50 zapier.com backlink it presented as live was still there
- Returned data for 79 of 101 keywords, including 17 of 25 questions
- Found 268 US keywords for organikpi.com, against SE Ranking's 36
- Answered all 15 simultaneous keyword requests
- Median keyword response of 782 ms
Semrush API cons
- SEO API listed only on the Advanced plan, 455.67 dollars a month billed annually, with units bought separately
- 40 units per backlink row and 10 per keyword row on the v3 endpoints we used
- No per-engine AI search data in the SEO API
- Some v3 errors return HTTP 200 as plain text, and the v3 key travels in the URL
- Its trend's last value jumped more than 2x for 23 of 72 keywords, and web hosting's volume reads 673,000 against 22,200 a year earlier
- 8 of its 45 live zapier.com rows were form actions or frames, not hyperlinks